Outcome reports enable you to quickly demonstrate the impact your service is having on your participants.
- When selecting the Reports icon from the Dashboard you will see two button selections – Process reports and Outcome reports.
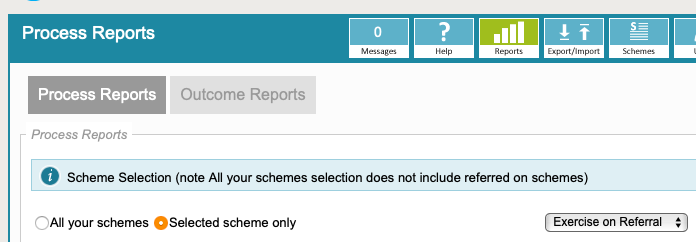
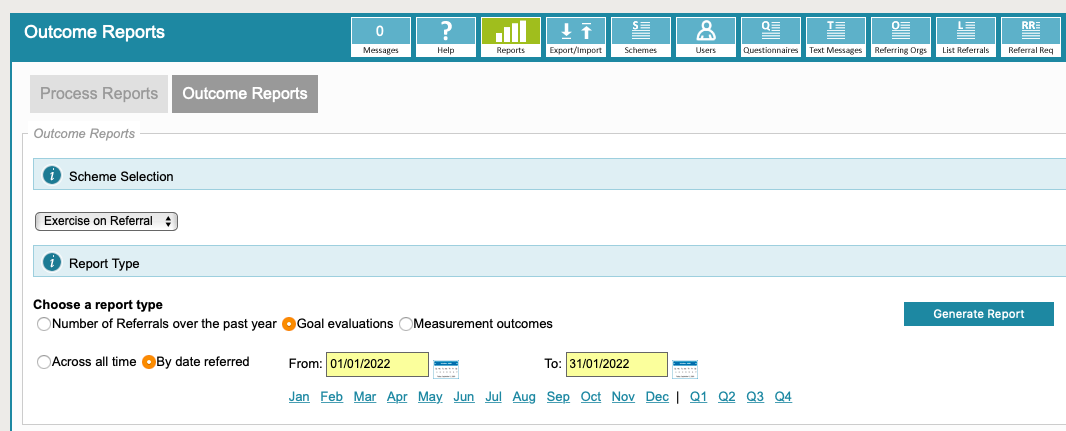
- Select Outcome reports and the below selections display:
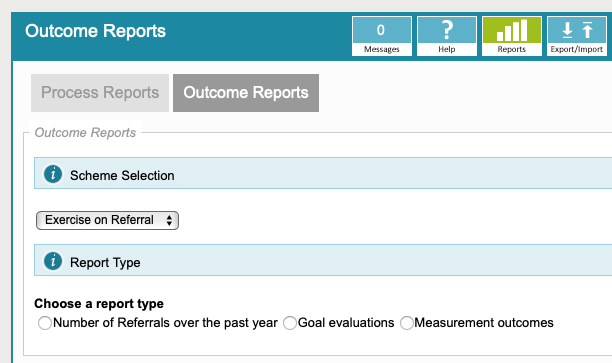
- Choose a scheme (Scheme Selection section) and what the type of outcome report.
- After selection, click Generate Report and choose from two views, Stacked Bar Chart (default) or Grouped Bar Chart.
Number of Referrals in the past year report:
In the example below we ran a report on Number of Referrals in the past year on the EoR scheme in our demo system.
- In this first screenshot I chose stacked bar chart view.
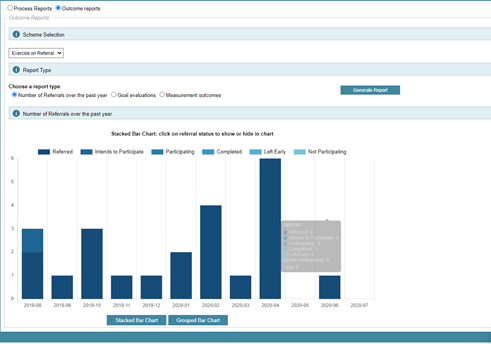
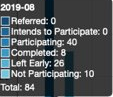
- Hover-over any of the bars to display how many referrals are in the chosen status. An example of what you would see when you hover is below:
- The next screenshot is the same Report in Grouped Bar Chart view:
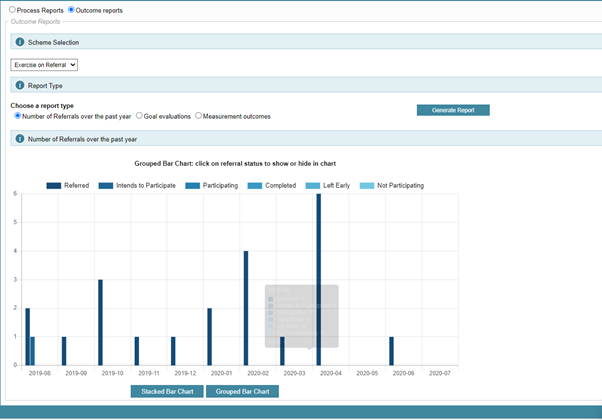
- Apply the same principles, you can hide or show the various status, and hover-over to see the totals breakdown.
Goal Evaluation report
Applies to: Schemes configured with ReferAll's Goal Setting / Goal Evaluation question panels.
- This report can be filtered to Across all time and By date referred - Click Generate Report and displays the success rate (%) for each goal theme and their totals. An example of one is below:

Measurement Outcomes report
Applies to: Questionnaires configured with data types that calculate a score.
- Select Across all time or By date referred, click Generate Report
- The table results display:
- The Mean (average) values of Initial Qs for all referrals within the data set with the Mean (average) values of subsequent Qs.
- Change % of the above.
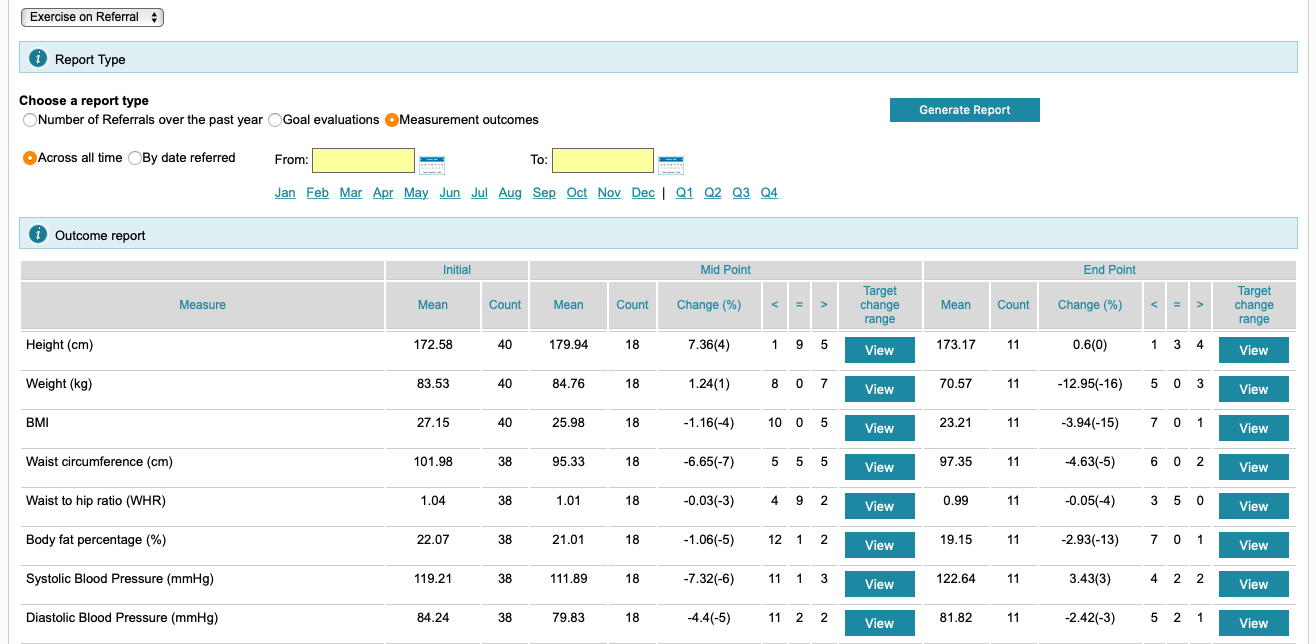
-
- The number of referrals whose scores have increased, stayed the same or decreased at each intervention point compared with the Initial value.

- If you select Target Change Range / View button next to any of the measurements, you will see more detail below the table:

The example above demonstrates the number of people that have achieved a percentage change in weight. Anything to the left of zero = negative indicating that the person/people has lost weight. Anything to the right of zero = positive indicating that the person/people has gained weight.
Scheme referrals by Medical Condition
The medical conditions process report shows referrals - not to be confused with individual patients who may have more than one referral - with the medical conditions in your scheme ticked for each referral.
What the report does not include is a unique referral count for each line, but reports numbers, as per the example below:
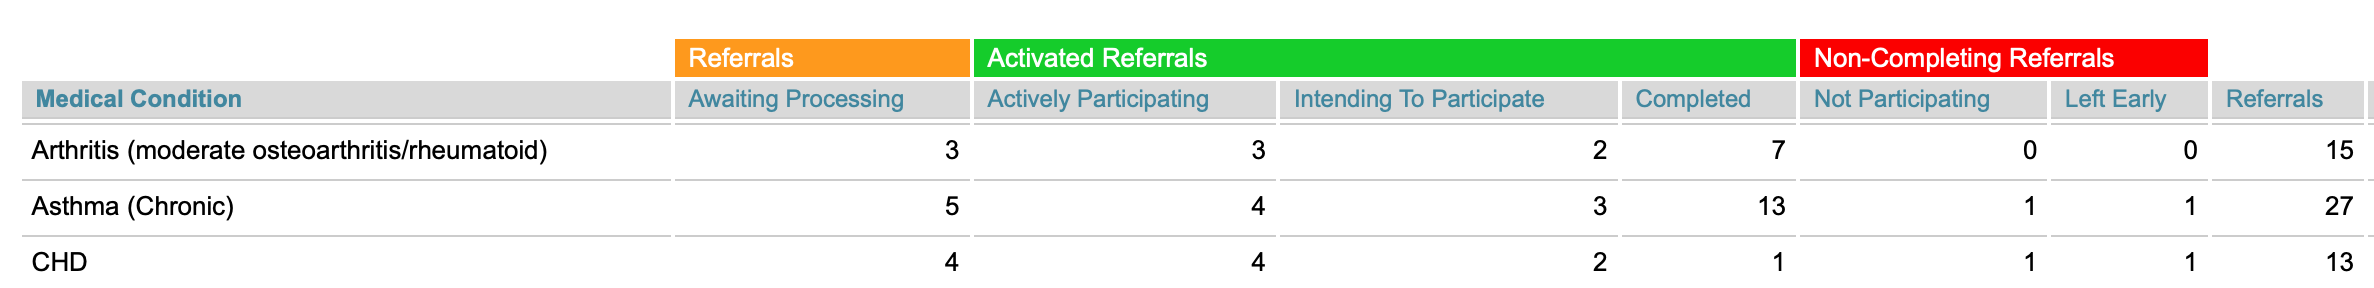
We recommend you run the medical conditions filter in conjunction with the Scheme Summary to ensure the figures are understood.
Please note: Measurements saved directly in a Biometric field (Biometrics tab in the referral record) will not appear in Outcome Reports. To include a biometric in Outcome Reports, it must be recorded via a questionnaire panel (set up by ReferAll Support). If you have any questions, please contact our support team.